The three mistakes revenue managers keep making
The short answer
- Topline can’t see what the booking cost. Two sources can post the same revenue and keep very different amounts once commission comes out. Rank sources on what you keep.
- A month is thirty decisions averaged into one. A segment up 4% for the month can be up 20% midweek and down a third at the weekend. The monthly line hides both.
- Managing by exception misses the slow moves. An alert catches the big drop. A competitor adding £3 a week for eight weeks never trips one, and that’s a 10% shift.
- The fix is the same each time. Read the number one level closer: net rather than gross, the day rather than the month, the small moves as well as the big ones.
Revenue management has a set of habits that look like discipline. Watch the topline. Review the month. Manage by exception. Each one was good advice once, and each one still sounds like the professional way to run a hotel.
Each one also has a blind spot, and the blind spots cost money quietly enough to go unnoticed for years. Here are the three, one worked example each, and what to look at instead.
Mistake one: why isn’t topline revenue enough?
Because topline can’t see what the booking cost you to win. Occupancy, ADR and RevPAR all describe what the guest paid, or what your PMS, the property management system that holds your bookings, recorded. None of them shows what you kept once commission came out. The occupancy trap covers why occupancy is the easiest of the three to buy. This is the mistake that sits underneath all three metrics.
It gets harder, because sources charge at different points. Some deduct commission before they pay you, so the PMS records the smaller figure. Some invoice after the guest has left, so the PMS records the full amount and the bill lands weeks later. Two sources, the same guest price, and the report is measuring them differently. Rank them on that report and you’re comparing numbers that were never related.
An OTA, an online travel agency, sells 600 room nights in a month. Your website sells 500. Every one is £100 including 20% tax, the UK rate, so £80 net of tax. On the report the OTA leads: £48,000 against £40,000. Then its commission arrives, 15% of what the guest paid: £9,000. What you kept: OTA £39,000, direct £40,000. The report’s winner lost by £1,000.
The decision that follows the report is the expensive part. The OTA gets more availability and more of next month’s spend, because it topped the table. The table was measuring the wrong thing. Gross versus net revenue walks through the three numbers one booking can produce.
Rule of thumb: rank your sources on what you kept, not what the guest paid.
Mistake two: what does a monthly summary hide?
Everything that happened on a Tuesday. A month is thirty or so stay dates averaged into one line, and the average is what makes it readable. The trouble is that a segment, a group of guests who book for the same reason, rarely performs evenly across a month. It runs strong on some days of the week and weak on others, and the total can look healthy while both halves are moving.
Take a business segment that finished the month at 1,040 room nights against 1,000 for the comparison period, matched day for day. Up 4%, so the summary says it’s working. Break the same month into days of the week and it reads differently. Monday to Wednesday sold 720 nights against 600, up 20%. Thursday was flat at 160. Friday to Sunday sold 160 against 240, down a third.
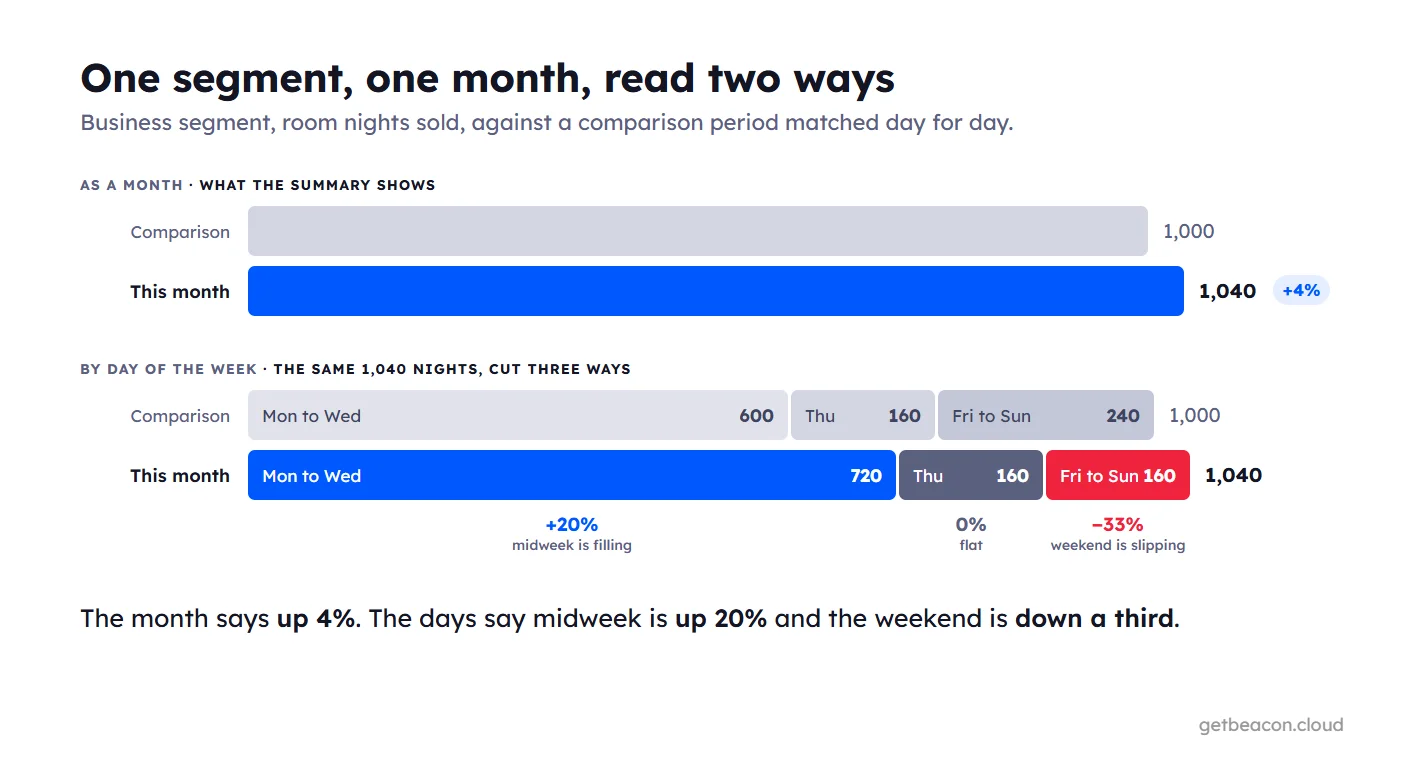
Now picture the decision that looks logical on the monthly line. The segment is growing, so when a corporate account asks for a deeper midweek discount, it gets one. Midweek was the part that was already filling. The discount goes to nights that were selling anyway, and the weekend, where the segment is actually losing ground, never gets looked at because the total was green.
The comparison matters as much as the split. A Saturday needs to be read against a Saturday, and the period you compare with should be the one that answers your question, not the same month last year by default. And read it by booking date as well as stay date, because a segment that’s slipping shows up in what you sold this week long before it reaches a month-end report.
Rule of thumb: a month is thirty decisions. Read the days before you make the thirty-first.
Mistake three: what does managing by exception miss?
The moves too small to be an exception. Managing by exception means setting thresholds, letting the system run, and only stepping in when a number crosses a line. In a market where a competitor can change a rate on any of 365 dates at any hour, it’s the only way to keep your time. The blind spot is anything that shifts gradually.
A competitor adds £3 to its Saturday rate every week for eight weeks. No single move is worth an alert. By the end, the Saturday is £24 higher, a 10% shift on a £240 room, and you’ve been the cheapest hotel on the street for two months without ever deciding to be. It happens in reverse when a competitor drifts down and takes the bookings you were pricing for. And it happens by room type: their family rooms creep up while their doubles hold, and a hotel-level average never shows it.
The answer isn’t to give up managing by exception. It’s to stop throwing away everything that isn’t one. Rank every move by how much it matters, act on the big ones first, and keep the small ones in view so the slow shifts get read together rather than dismissed one at a time. Read them by room type, mapped like for like, so a shift in one category doesn’t get averaged away by another. Competitor rate drops covers the other half: what to do when the big one does land.
Rule of thumb: exceptions first. Never exceptions only.
What do the three mistakes have in common?
Each one reads a number at the level where it’s easiest to read, and stops. Topline instead of net. The month instead of the day. The exceptions instead of everything. The fix is the same each time: one level closer.
Three questions to ask your data this month:
- Which column ranks your sources? If it’s what the guest paid or what the PMS recorded, re-rank on what you kept and see whether the order holds.
- Which segment is up for the month, and on which days? If you can’t split the total by day of the week, you can’t act on it without guessing.
- What has moved by less than your alert threshold this quarter? Add up the small moves by competitor and by room type. The total is the shift you’ve been missing.
See the month by the day, and the booking by what you kept.
Explorer reads live from your PMS: gross, net of tax or net of commission on every page, segments by the day, and every figure against the dates you choose, matched day for day. Included from the Clarity plan at £2.50 per room/month plus Rate Radar at £91/month.
Book a demoFrom £2.50 per room / month · requires a PMS connection
Common questions
Setting thresholds and only stepping in when a number crosses one: a competitor drop above a set size, or a date behind pace by more than a set amount. It saves time, and it works for big moves. It misses gradual ones, because a change that arrives in small steps never crosses the line. Keep the exceptions first, and keep the smaller moves in view so you can read them together.
For nights that have happened, it’s the fairest single score, because it combines rate and occupancy. It’s still topline. Two hotels with the same RevPAR can keep very different amounts once commission comes out, so read it beside revenue net of commission, and rank your sources on what you kept rather than what the guest paid.
Daily, by day of the week, against a comparison period matched day for day. A monthly total can hide a segment growing midweek and shrinking at the weekend. Reading by day shows where the segment is actually moving, and reading by booking date shows the change weeks before it reaches a month-end report.