Hotel Analytics SoftwareReal-time hotel analytics.
From bookings to insights.
Room and ancillary revenue updated in real-time. No spreadsheets.
Three ways to see your revenue
Commission distorts your ADR. Explorer shows you exactly how.
Three guests each book a room at £100. Same rate, different channels.
| Revenue | ADR | |
|---|---|---|
| Direct | £80 | £80 |
| OTA (net, 15%) | £68 | £68 |
| GDS (gross, 15%) | £80 | £80 |
| Total (3 rooms) | £228 | £76 |
Same rack rate, but OTA shows a lower ADR. Commission was already deducted.
Running a visibility booster? Set the increased commission by channel and dates. Explorer adjusts your Gross and Ex Com & VAT views automatically.
AI that reads the data
so you don’t have to
Every Explorer page includes an AI Insights panel. It analyses the data and organises findings into three categories.
Every number your hotel runs on.
Channels, segments, room types, cancellations, no-shows, maintenance. All in one place.
Performance & Distribution
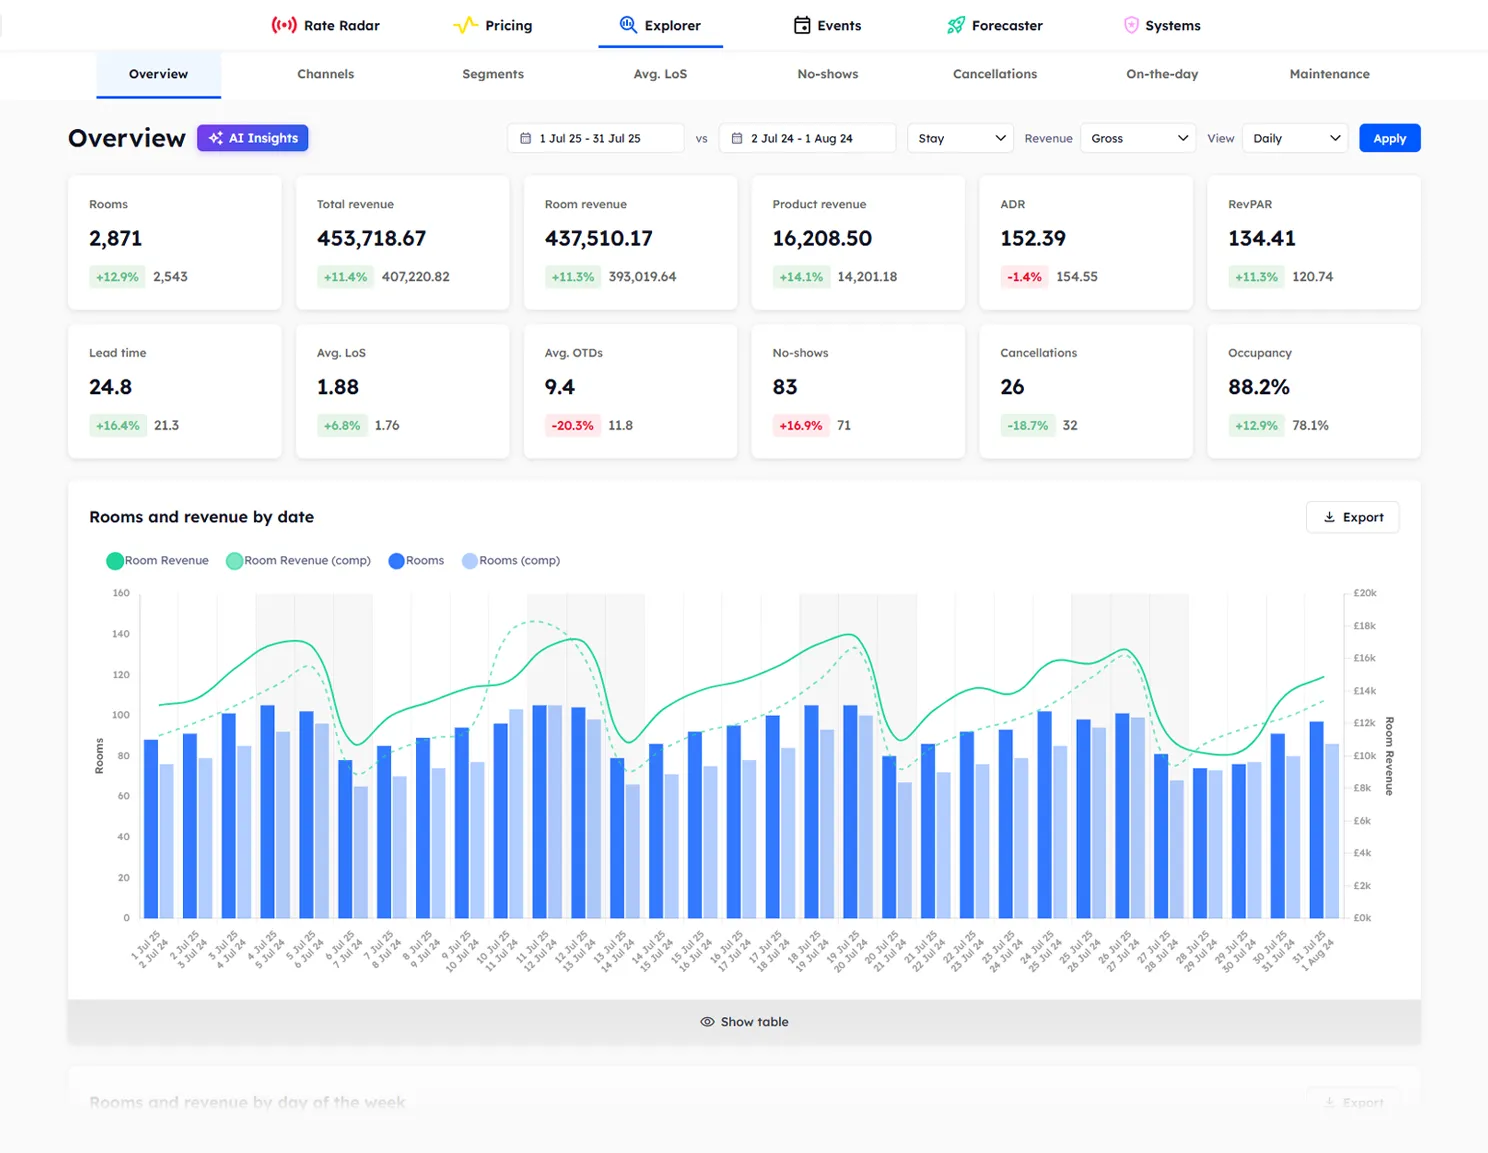
Overview
Your hotel’s performance at a glance. Room and ancillary revenue, ADR, RevPAR, and more.
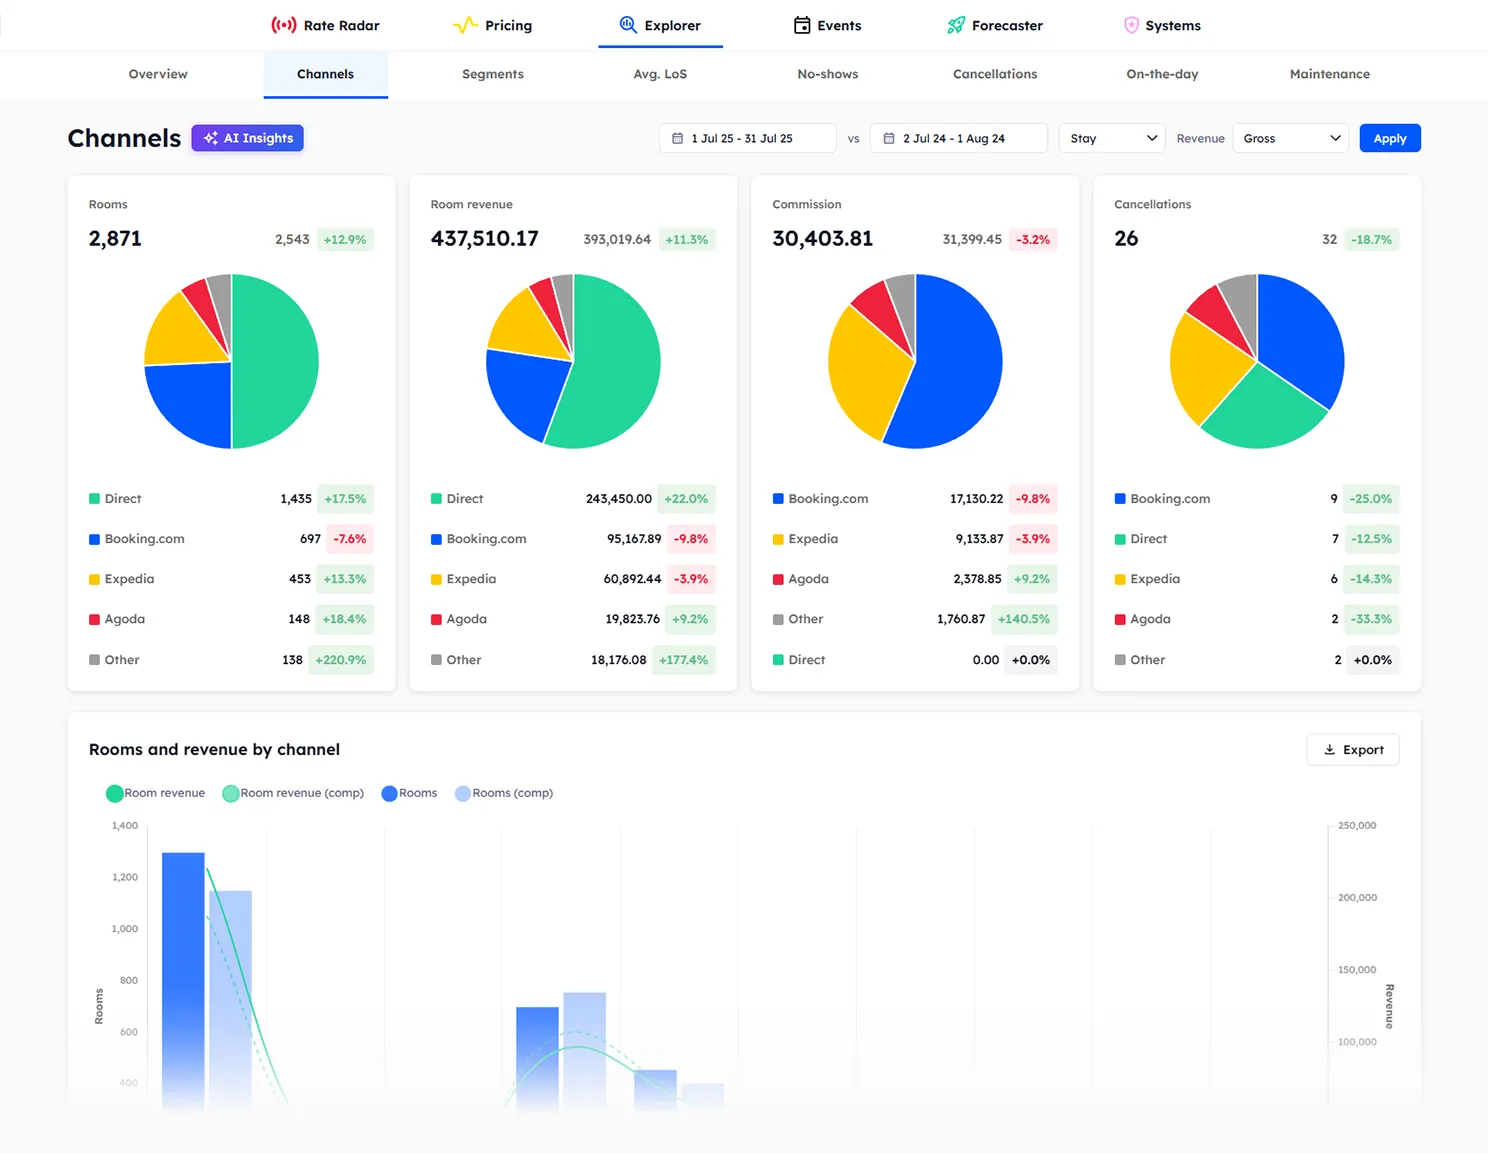
Channels
See where bookings come from and what each channel really costs per booking source.
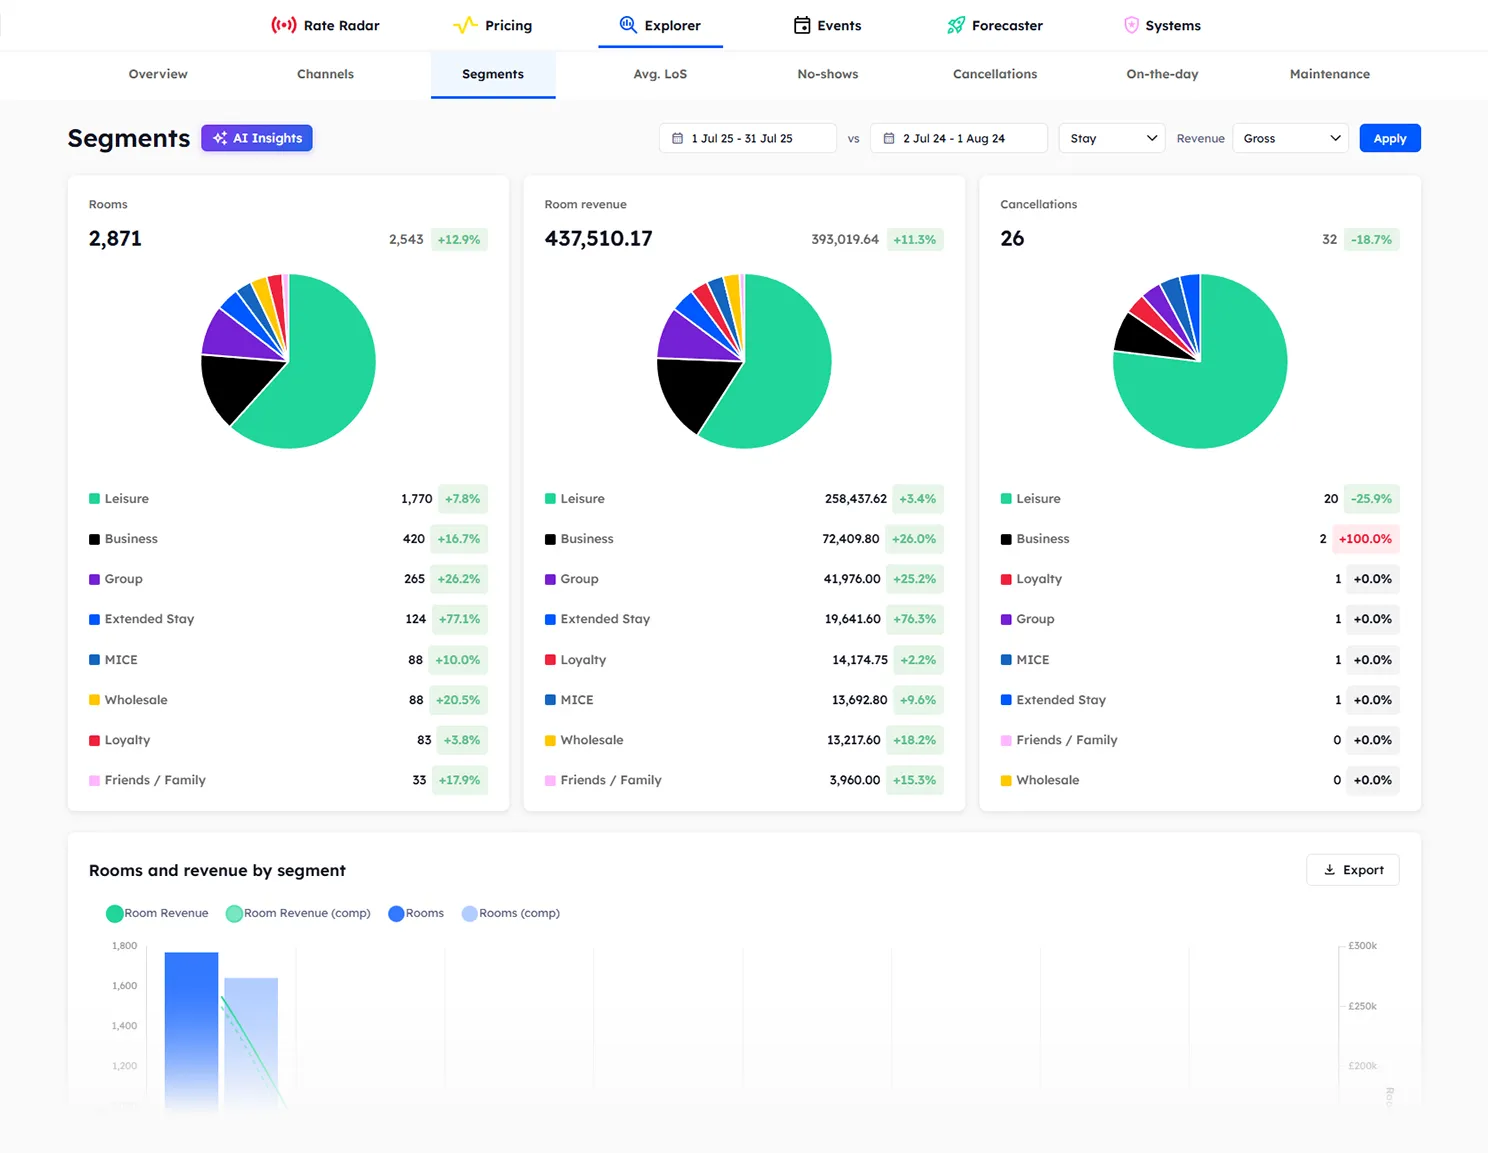
Segments
Break down performance by guest type: leisure, business, group, wholesale, and more.
Risk & Revenue Loss
No-Shows
Spot no-show patterns by channel, segment, room type, and day of week.
Cancellations
Analyse cancellations by channel, segment, and room type. See the room and ancillary revenue impact.
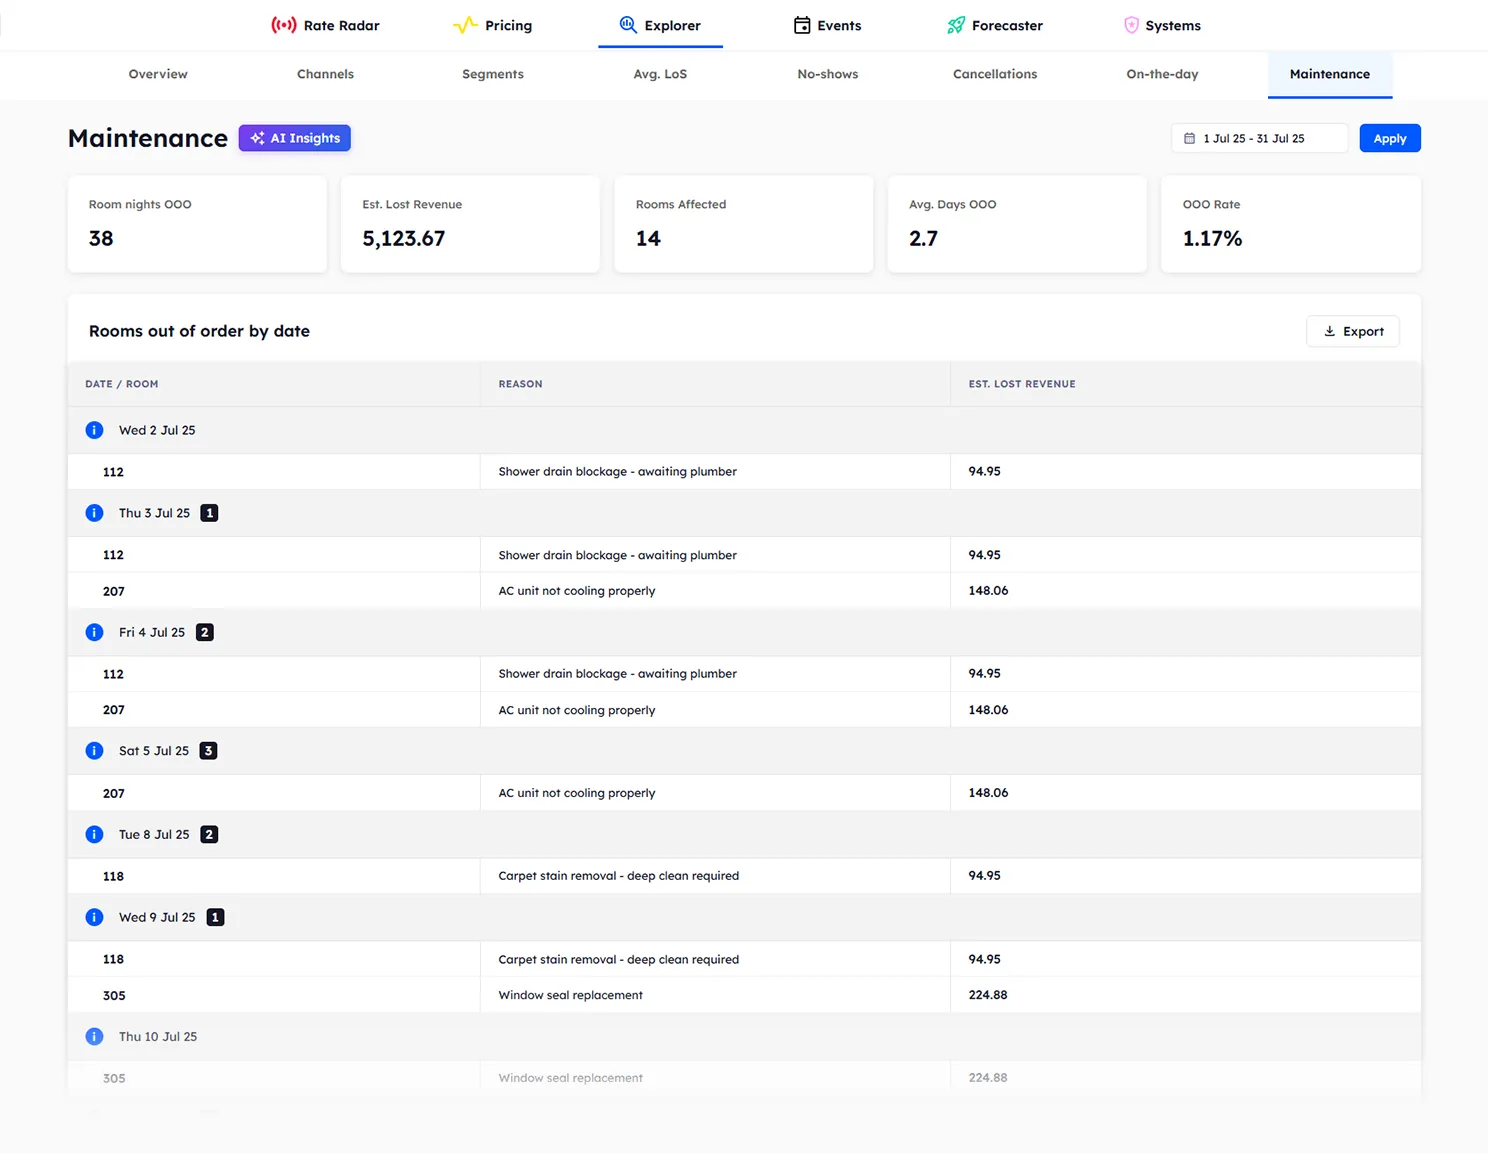
Maintenance
Rooms out of order with lost revenue, room types and average duration to spot trends.
Booking Patterns
Length of Stay
Identify stay patterns by date, day of week, room type, and segment.
On-The-Day
Same-day and walk-in booking analysis with ADR and revenue tracking.
Explorer FAQs
Explorer is the real-time business intelligence module in Beacon. It gives hotel teams live visibility into room and ancillary revenue, bookings, channels, segments, and operations, updated the moment a booking is made, modified, or cancelled.
Explorer connects directly to your PMS. Data updates in real-time as bookings are made, modified, or cancelled. No manual imports, no CSV uploads, no overnight batch processes.
Gross shows what the guest actually paid, reconstructing commission deducted at source for accurate cross-channel comparison. Net shows what the PMS recorded, after any commission deducted at source. Ex Commission & VAT shows what the hotel actually kept, stripping out VAT and retrospective commission.
Every Explorer page includes a built-in AI Insights panel. It analyses the data on that page and organises findings into three categories: Positives (growth and wins), Observations (patterns and context), and Concerns (anomalies and risks). Each insight includes a headline, key metric with comparison, and a plain-language recommendation.
Explorer includes 8 analytical pages: Overview (executive summary dashboard), Channels (booking source and commission analysis), Segments (guest type breakdown), Length of Stay (stay pattern analysis), No-Shows (missed arrivals), Cancellations (cancellation patterns and costs), On-The-Day (same-day booking analysis), and Maintenance (rooms out of order with lost revenue).
Yes. Every metric shows a comparison to your chosen period with percentage change, colour-coded green for improvement and red for decline. Comparisons are always weekday-aligned, so Mondays compare to Mondays, weekends to weekends. You choose the comparison period.
Yes. Every report can be exported. Download the data for your own offline analysis or to share with stakeholders.
Explorer requires a PMS connection and is available on two tiers. Insight includes Explorer, Rate Radar, and Pricing starting at £4 per room per month. Predict adds Events and Forecaster starting at £5 per room per month.
Stay date shows performance based on when guests actually stayed. Creation date shows when bookings were made. Available on every Explorer page.
Simple pricing.
Explorer is included in the Insight and Predict tiers alongside Rate Radar and Pricing. Predict adds Forecaster and Events.
- check Rate Radar
- check Pricing
- add Live revenue, ADR, RevPAR & occupancy tracking
- add Revenue views: Gross, ex-VAT, or ex-commission
- add AI Insights
- add Shareable reports
- check Everything in Insight
- check Events
- check Forecaster
- add Intelligent pricing suggestions
- add Group pricing calculator
All prices exclude VAT and applicable taxes.
See your hotel’s data in real-time
Book a demo to see Explorer in action, or try Rate Radar for free.